In the land down under, where the sun beats down relentlessly across vast expanses of land, solar power has emerged as a beacon of hope for renewable energy enthusiasts. Australia, with its abundant sunlight and vast landscapes, seems ideally positioned to capitalize on solar energy. However, as the specter of climate change looms larger, the efficiency and reliability of solar power systems come under scrutiny.
2013-2017 was the hottest five-year period on record, and July 2023 was the hottest month humanity has ever experienced. All an impact of man-made climate change and largely our dependency on fossil fuel energy consumption. Fossil fuels continued 71% of total electricity generation in 2021, including coal (51%), gas (18%) and oil (2%).
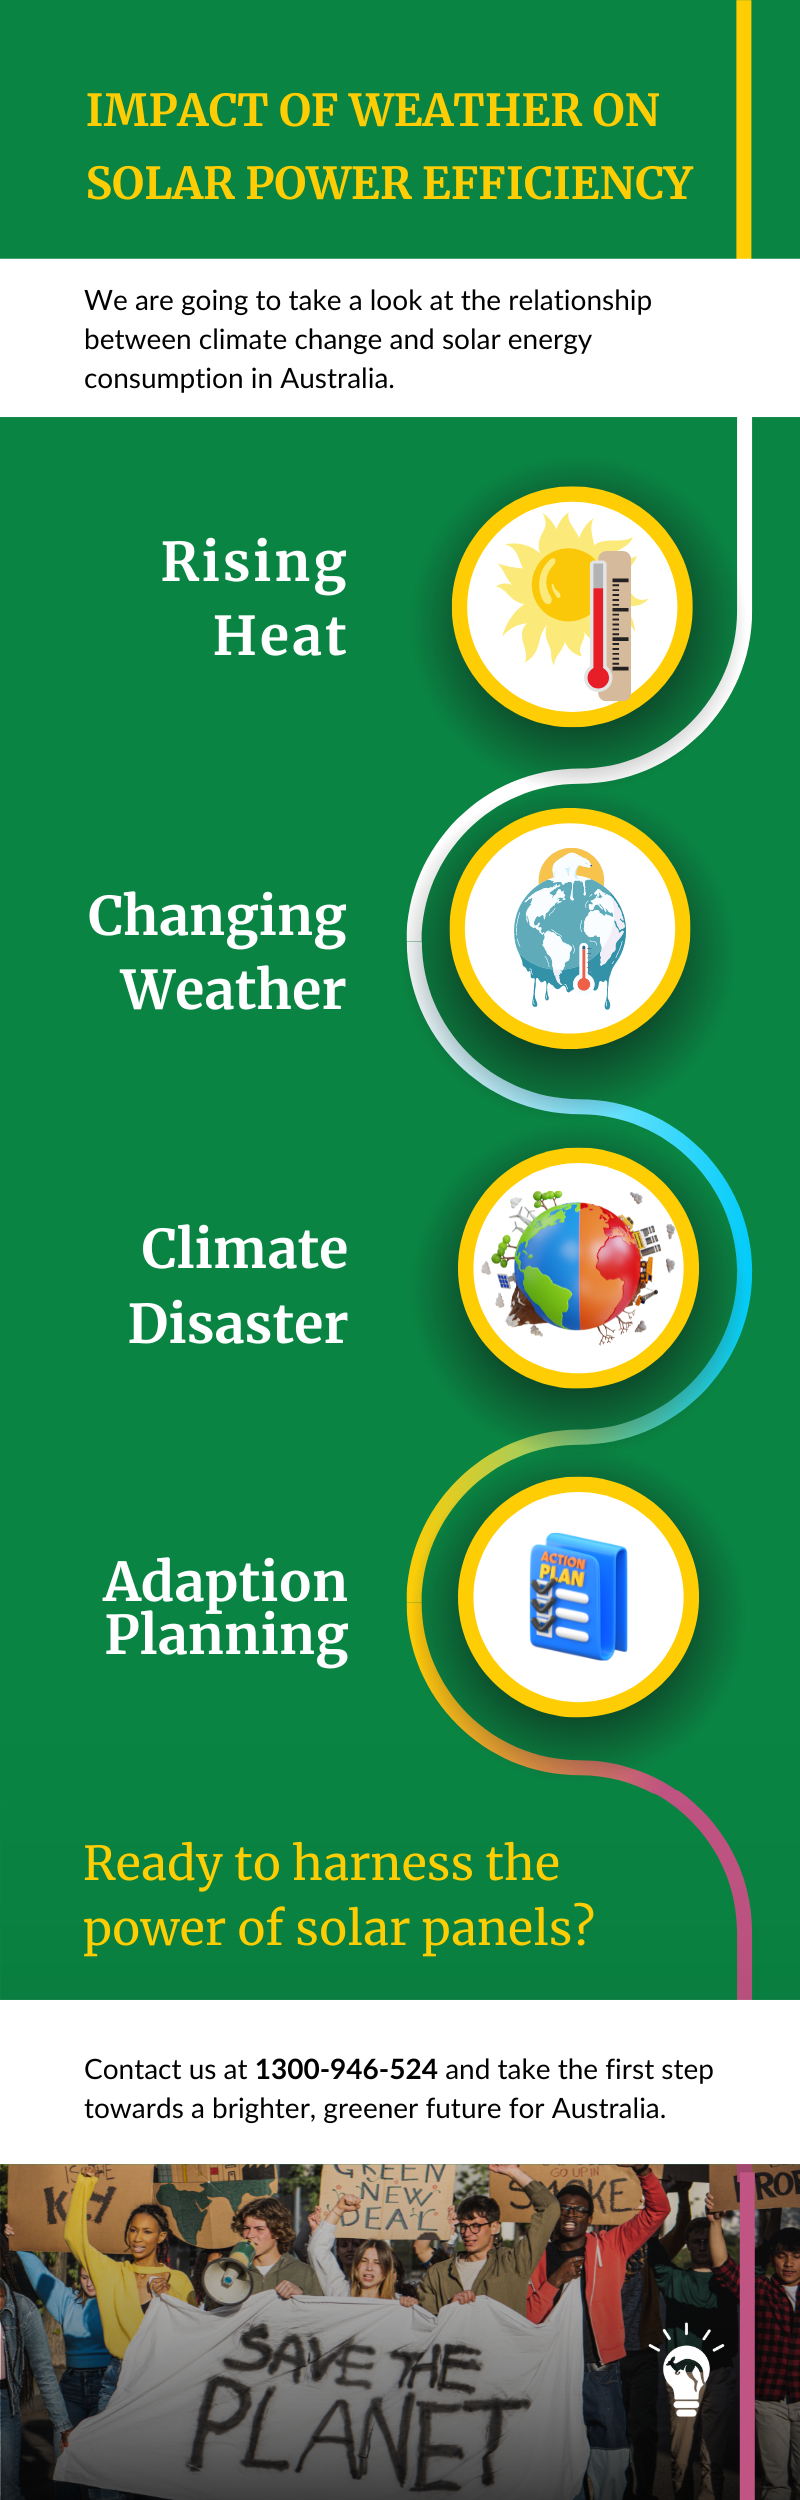
In this infographic, we are going to take a look at the relationship between climate change and solar energy consumption in Australia, exploring how climate change has impacted this industry so far and how it may continue to do so in the future.
Contact us today to learn more about our products and services and take the first step towards a brighter, greener future for Australia and beyond. Let us power change together with Solaris Tech.


SHARE ON